Same Loss, Different Year: What Default Timing Does to a Private-Credit Fund's DPI
Why this matters now
Private credit has become a core institutional allocation, and its loss experience is still disclosed the way it was when the asset class was small. An allocator underwriting a direct-lending fund receives a coupon, a deployment pace, and a loss expectation stated as a cumulative default rate with an assumed recovery. That is an amount. It says nothing about when in the fund's life the losses will be realized, and the two metrics on which track records are compared, the multiple and DPI at maturity, cannot say anything about it either, because both are ratios of total money out to total money in. The one common metric that registers timing at all, IRR, arrives as a single point, and its sensitivity to the calendar of cash flows has been documented for nearly two decades.
That gap in the disclosure would matter less if losses arrived evenly. The current cycle is producing the opposite pattern. Proskauer's Private Credit Default Index recorded a default rate of 2.51% for the second quarter of 2026 across 716 loans. Beneath that headline, the composition of interest has shifted: Lincoln International reports payment-in-kind interest present in 11% of loans and 11% of total interest income in the same quarter, with "bad PIK", PIK toggled to preserve a borrower's liquidity rather than by original design, present in 6% of all loans, a figure Lincoln describes as a shadow default rate. PIK defers cash to maturity, and on a loan that ultimately defaults it is lost in full. A book in which losses are being deferred inside loans is a book whose loss experience will arrive late and clustered, after the investment period. That is the pattern this piece shows to be invisible in interim performance.
And interim performance is what LPs now decide on. Distributions have been the binding constraint of the last three years, and DPI has moved from an afterthought to the first number an LP asks about, because distributions, not marks, fund the next commitment. The two decisions an LP makes off a credit fund, whether to commit to the successor fund and how to pace the program, both key off DPI. This piece shows that DPI is the metric most exposed to the timing of losses and least informative about their size.
The question that follows is narrow and answerable. Holding the loss amount exactly fixed, what does the timing of the losses do to what the LP actually receives, and when? The figures below come from a loan-level model of a single direct-lending fund under stated assumptions. The four findings are derived first from the cash-flow arithmetic and then confirmed by the model, so the reader is not asked to trust a table; the derivations are in the companion note.
The experiment
Why a controlled experiment rather than a track record. In any realized fund the timing of losses is confounded with everything else that differs between funds: the size of the losses, the vintage, the credit cycle the book lived through, the mix of borrowers, the manager's terms. No two funds with the same loss rate and different loss calendars exist to be compared, and even if they did, the comparison would not isolate timing. The experiment removes every other difference by construction. The fund, its terms, its loans and its total loss are held fixed to the dollar; the only thing that changes between scenarios is which loans default, and therefore when the loss cash flows occur. Whatever then differs in the LP's outcome is attributable to timing and nothing else. The fund is built from the loan up rather than from a fund-level cash-flow curve because loss timing is a loan-level property: it is the age of each loan at default, not a parameter of the fund's J-curve, that decides when a coupon stops and when a principal shortfall is realized.
Why these numbers. Sixteen equal loans originated one per quarter give a four-year investment period with a clean quarterly grid of placements, so that "one slot later" has a fixed meaning of three months. Four defaults is a stress case, not a forecast: it is a 25% cumulative default count over the fund's life, well above the 2.5% annualized rate Proskauer reports for the current quarter, chosen so that the timing effect is large enough to read and so that the fund still clears or narrowly misses its hurdle, where the waterfall result is visible. A 30% loss given default is the conventional senior-secured assumption; a defaulted loan that pays for half its life reflects that middle-market defaults are rarely at origination. The fee set is the market-typical end for senior direct lending. Each of these choices is relaxed in the parameter sweep further down, which is what allows the results to be stated generally rather than for this fund alone.
The modeled fund commits $100 million and originates sixteen loans of equal size, one every three months across a four-year investment period. Each loan is a four-year bullet paying a 10% cash coupon and a 2% closing fee. Fund terms are set at the market-typical end for senior direct lending: a 1.25% management fee on invested capital, a 7% preferred return and 10% carried interest. Nothing about the fund's structure changes between scenarios.
Four of the sixteen loans default, a 25% default count by number. A defaulted loan performs for the first half of its life, then stops paying; at maturity 70% of its principal is recovered. Because every loan is the same size and carries the same terms, four defaults cost the same in every scenario: $11.9 million of lost interest and principal, before fees and the waterfall.
What varies is only which four loans default:
- Early: the first four loans originated, so the losses land in years three and four of the fund.
- Spread: every fourth loan, so the losses are distributed across the book.
- Late: the last four loans originated, so the losses land in years seven and eight.
A fifth run, with no defaults, is the reference. The full set of assumptions:
| Fund and loans | Fees and waterfall | ||
|---|---|---|---|
| Commitment | $100M | Management fee | 1.25% on invested capital |
| Loans | 16, equal size ($6.25M) | Fund expenses | 25 bp |
| Origination | one per quarter, years 1–4 | Preferred return | 7% |
| Loan tenor | 48 months, bullet | Carried interest | 10%, full GP catch-up |
| Cash coupon | 10% | Waterfall | whole-fund (European) |
| Closing fee | 2%, retained in the fund | ||
| PIK | none (base); 8% cash + 3% PIK sensitivity | ||
| Fund life | 8 years, no recycling | ||
| Defaults (held fixed) | What varies | ||
| Number | 4 of 16 (25% by count) | Placement | early / spread / late |
| Loan stops paying | at half its tenor (month 24) | Reference | no-default run |
| Recovery | 70% of principal at maturity (LGD 30%) | Wider grid | 2, 4, 6 defaults × LGD 15 / 30 / 50% |
| PIK on a defaulted loan | lost in full | Sweep | 533,520 runs (see "How general is this") |
| Nominal loss | $11.85M in every placement |
Assumptions of the controlled experiment. Everything in the left-hand blocks is identical across the three placements; only the right-hand block changes.
What the multiple sees: nothing
| Scenario | Nominal loss | LP net multiple | LP net IRR |
|---|---|---|---|
| No defaults | 0 | 1.29x | 8.19% |
| Early defaults | $11.9M | 1.21x | 5.61% |
| Spread defaults | $11.9M | 1.21x | 5.87% |
| Late defaults | $11.9M | 1.21x | 6.15% |
The LP's net multiple is 1.208x in all three loss scenarios, to the third decimal place. This is not a rounding coincidence. A multiple is a ratio of money out to money in, and the same dollars go in and come out whether a loss is realized in year three or year seven. Any comparison of two credit funds on TVPI, or on DPI at the end of their lives, treats a front-loaded loss experience and a back-loaded one as identical outcomes. They are not identical to the investor who lived through them.
What IRR sees: half a point
The IRR gap between early and late defaults is 54 basis points in the base case. Across the wider grid the study ran (two, four and six defaults; recoveries of 85%, 70% and 50%), the gap ranges from roughly 25 to 60 basis points. This is not a simulation artifact; it follows from the present-value identity. Moving a loss later in the fund's life raises the present value of the LP's cash flows by the loss times the difference in discount factors, and that quantity has the sign of the fund's own rate of return. Dividing by the fund's dollar duration gives the change in IRR in closed form, and the closed form reproduces the model's 4.5 basis points per quarter of loss timing exactly. The size is the part worth pausing on: half a point of net IRR, produced by timing alone, with the loss amount held constant and the manager's underwriting, by construction, identical.
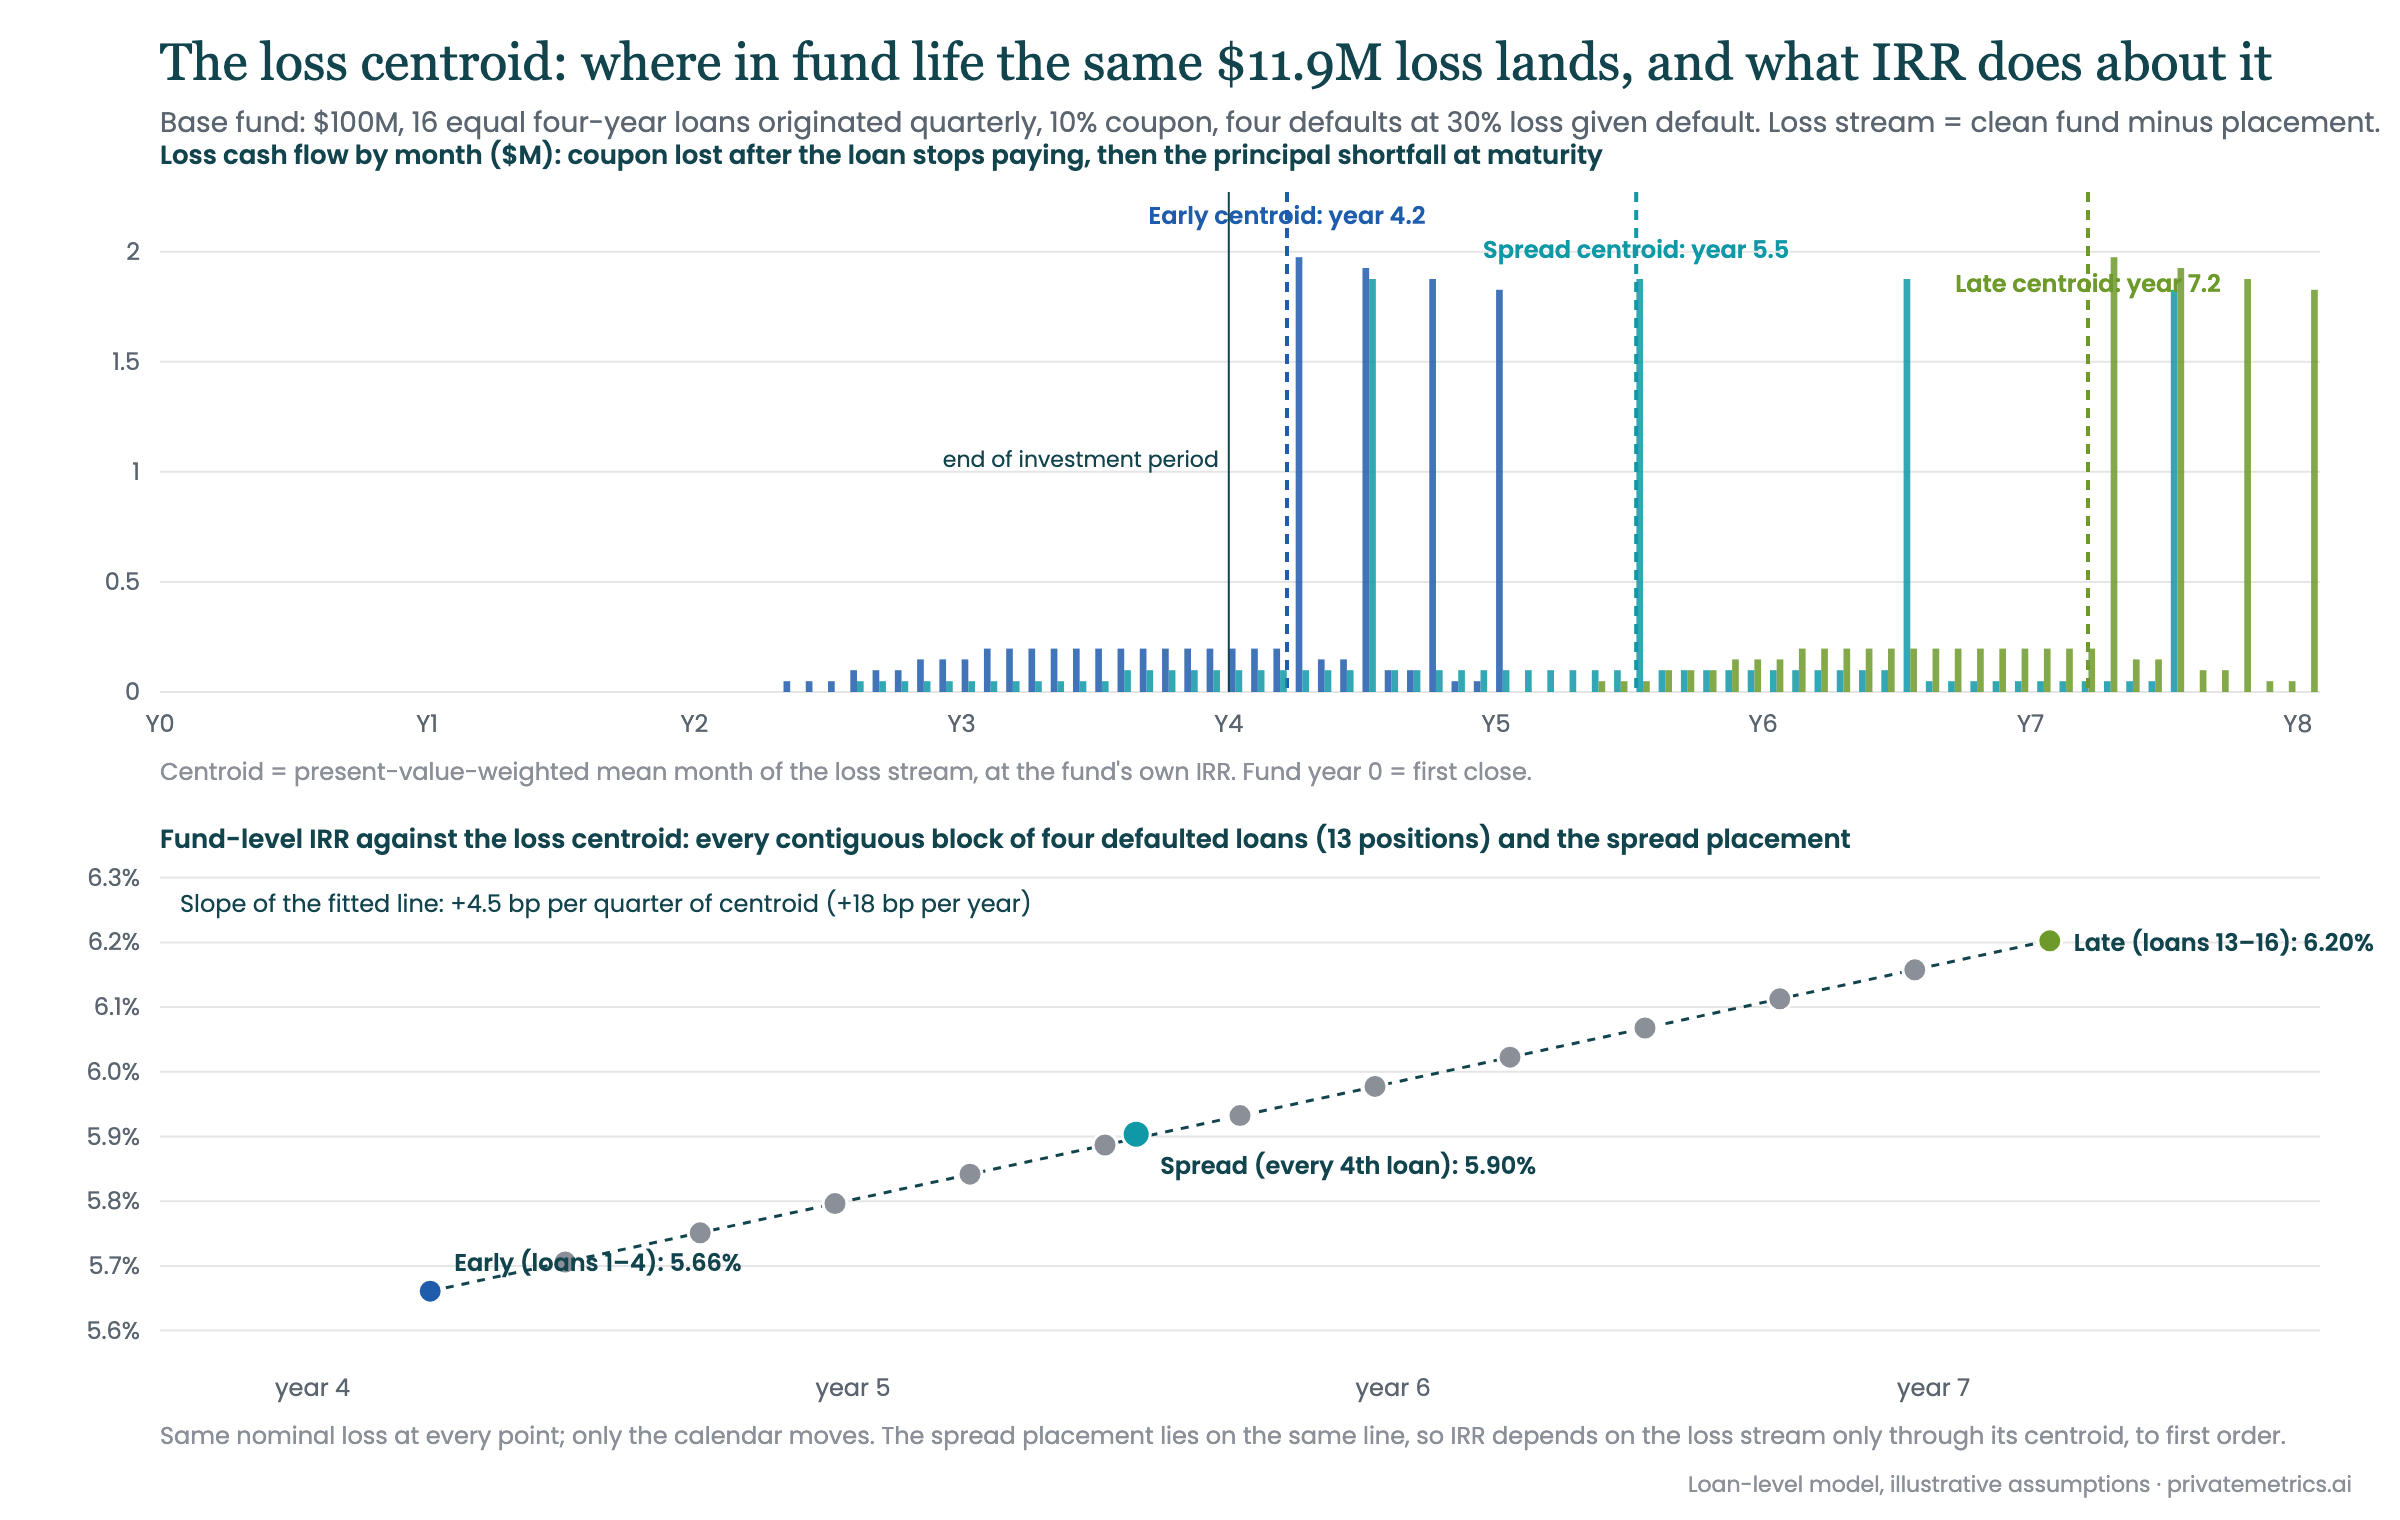
A useful way to see this is to collapse each placement's loss stream to a single date, its centroid: the average month in which the loss dollars leave the fund, weighted by present value. The upper panel shows what that means. Each placement's loss stream is a run of small bars, the coupon lost each month after a defaulted loan stops paying, followed by four tall bars, the principal shortfall realized when each loan matures. The early placement's centroid is at year 4.2, the spread placement's at 5.5, the late placement's at 7.2; the same $11.9 million sits under each. The lower panel slides the block of four defaulted loans through all thirteen positions in the book and plots the fund's IRR against the centroid. The points lie on a straight line, at 4.5 basis points per quarter, and the spread placement, which is not a block at all, lies on the same line. To first order the IRR does not care about the shape of the loss stream, only about its centroid.
What the DPI path sees: what the multiple hides
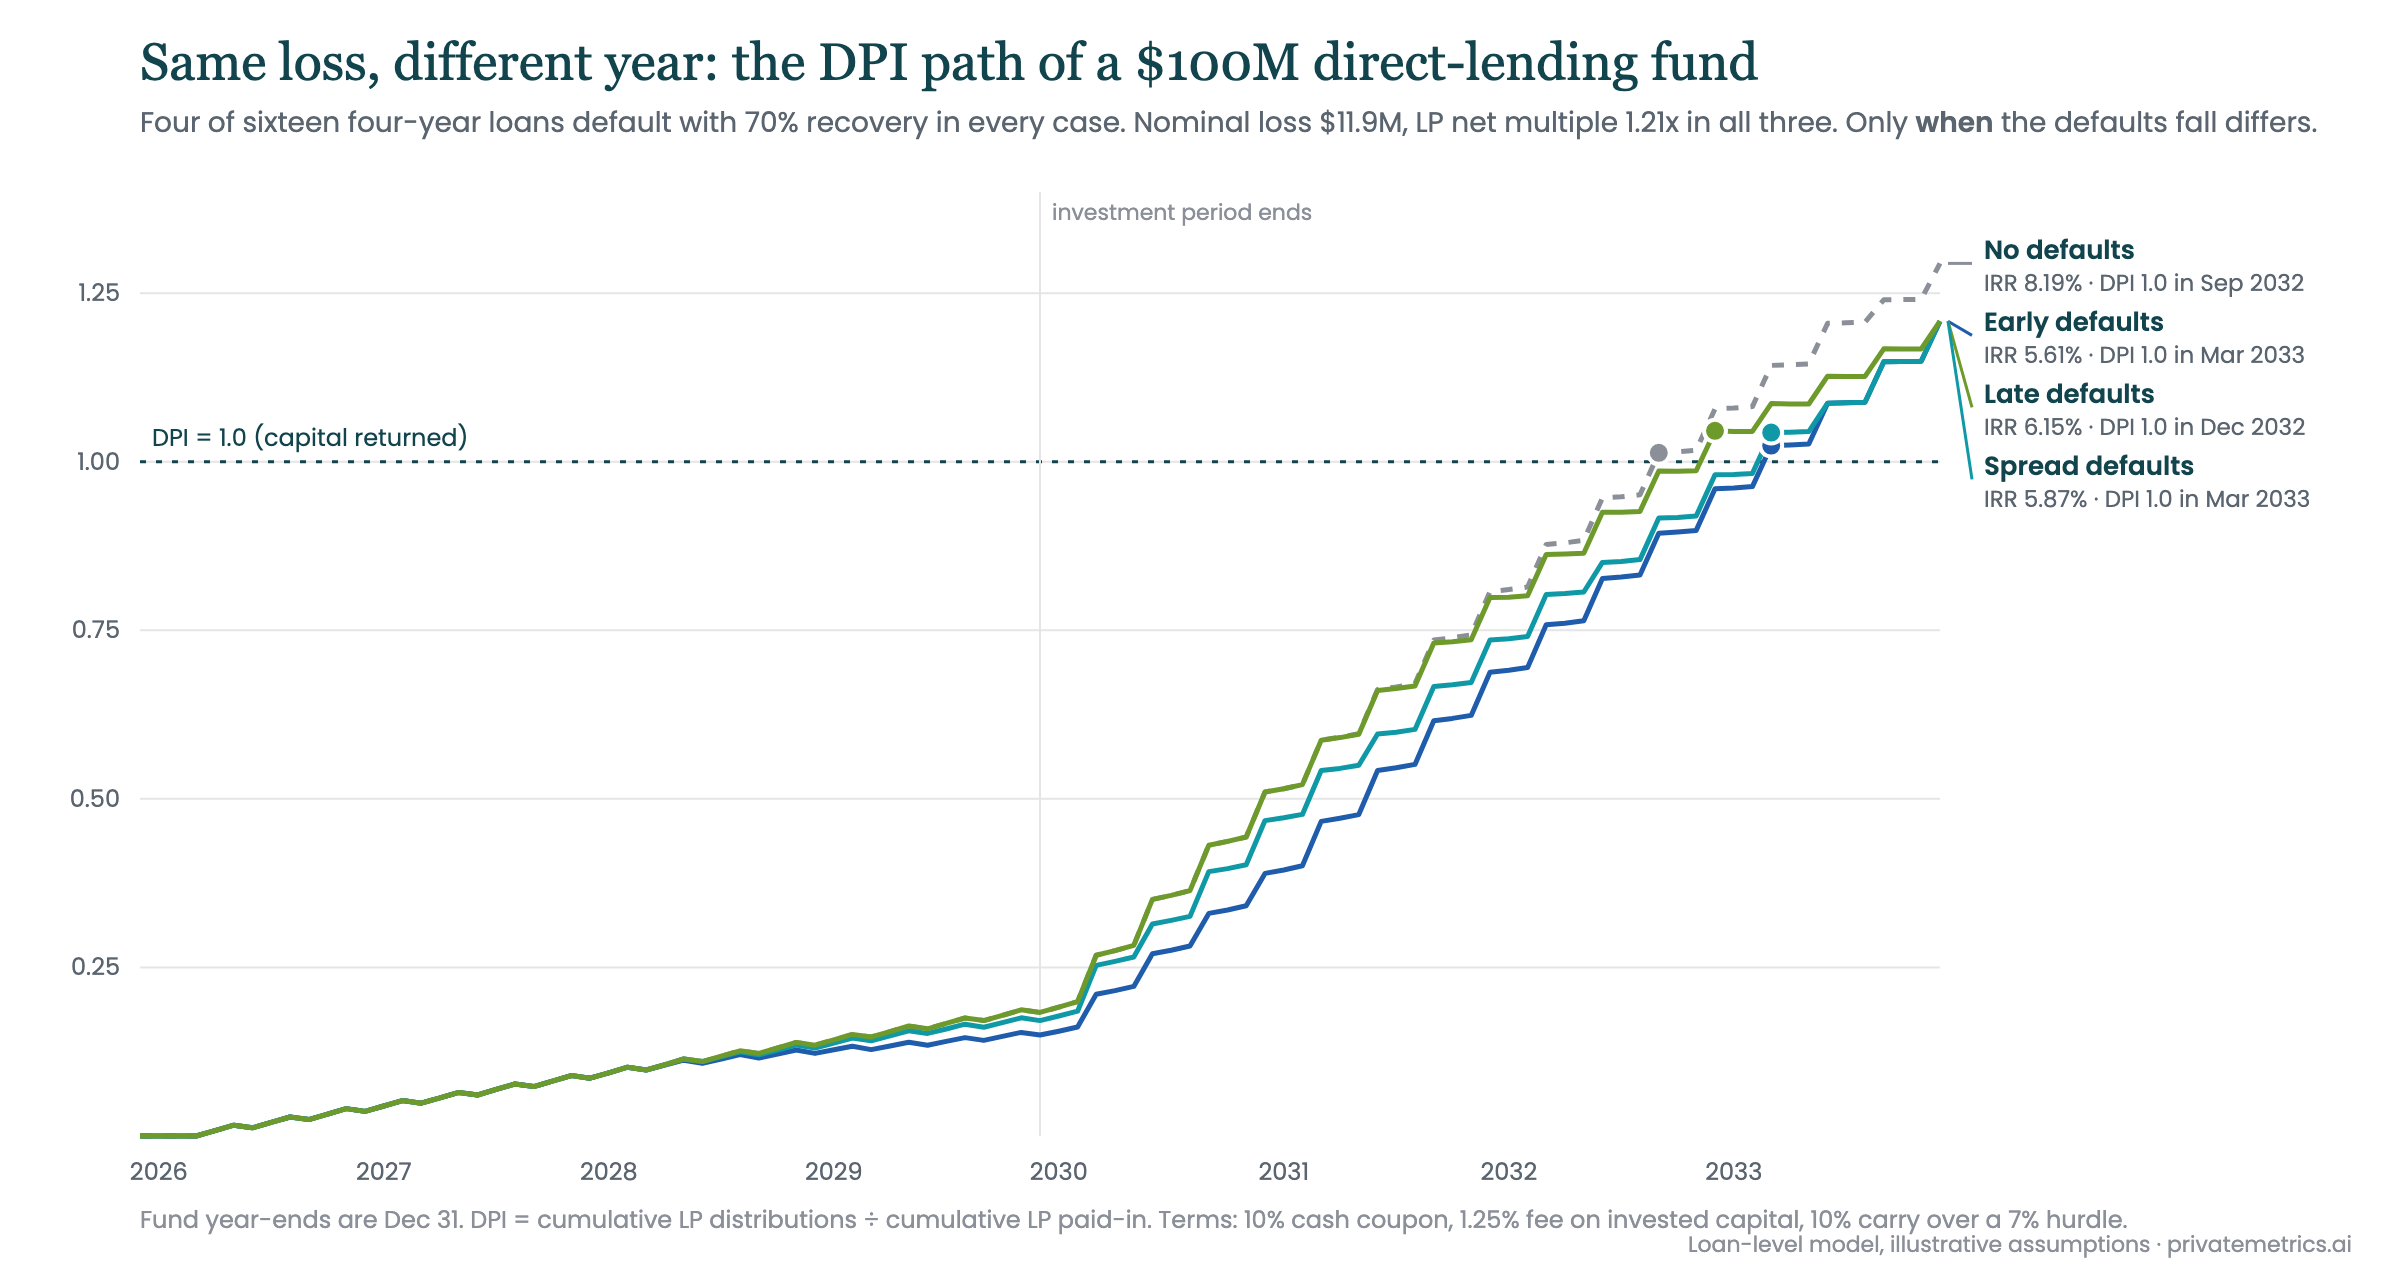
Three readings from the chart.
Distributions by the end of the investment period. The early-default fund has returned $14.3 million to the LP by the end of year four. The late-default fund has returned $17.5 million, the same as a fund with no defaults at all. A fifth less cash has come back from the early fund at exactly the point in a program's life when distributions from the last commitment are expected to help fund the next one. With four-year bullets, year four is all coupon; the gap is lost interest on the loans that stopped paying.
The date capital is returned. DPI reaches 1.0 in December 2032 for the late-default fund and in March 2033 for both the spread and early cases. A quarter separates two funds with identical losses and identical final multiples, and the no-default fund is a quarter ahead of the late one again.
The peak funding requirement. The LP's cumulative net outflow troughs at $78.0 million in the late and no-default cases, $79.2 million with spread defaults, and $81.2 million with early defaults. Early losses mean early interest shortfalls, which means the fund draws further into the commitment before distributions turn the line. For an LP holding a liquidity reserve against unfunded commitments, that is $3.2 million more reserve for the same headline loss rate.
The most important reading is the one the chart makes hard to miss. The late-default line lies on top of the no-default line for four years. An LP evaluating this manager at the end of the investment period, which is when the decision about the successor fund is usually made, would see a clean DPI record and a clean interim IRR. The losses are in the book. They have not yet been realized. Nothing in the interim performance reveals them.
The reverse is also true. The early-default fund looks worse at year four than it will finish. An LP comparing the two at that date would see an 18% shortfall in distributions and read it as an 18% worse fund. The eventual gap is 0.54 points of IRR and nothing on multiple. The interim record overstates the difference by an order of magnitude.
PIK makes every part of this larger
Much of today's direct lending carries a payment-in-kind component, either by design or through a toggle exercised under stress. PIK accrues to the loan balance and is paid at maturity, so it moves cash from the middle of a loan's life to its end. The study re-ran the same fund with an 8% cash coupon plus 3% PIK, a common unitranche shape, holding everything else fixed.
| 8% cash + 3% PIK | LP net IRR | LP net multiple | Distributions by year 4 | Peak net outflow |
|---|---|---|---|---|
| No defaults | 9.29% | 1.35x | $14.5M | $81.0M |
| Early defaults | 6.37% | 1.25x | $11.9M | $83.7M |
| Spread defaults | 6.69% | 1.25x | $13.6M | $81.9M |
| Late defaults | 6.97% | 1.25x | $14.5M | $81.0M |
Three things move at once. The headline improves: with no defaults, PIK lifts the net IRR from 8.19% to 9.29% and the multiple from 1.29x to 1.35x. The interim cash worsens: distributions by year four fall from $17.5 million to $14.5 million and the peak funding need rises by $3 million, because part of the return that used to arrive as coupon now waits for maturity. And the timing gap widens: early versus late defaults now cost 60 basis points at the LP level and 68 at the fund level, against 54 for cash-pay, because accrued PIK on a defaulted loan is lost in full and it sits at the back of the loan's life, so more of each loan's return is exposed at the moment it stops paying. PIK looks better on every terminal metric and worse on every interim cash metric. That is the same shape as the default-timing result itself, and the two compound.
Who bears the timing: a note on the waterfall
One more effect surfaced in the grid, and it is a waterfall effect rather than a timing effect, so it is stated separately. With two defaults instead of four, the fund clears its 7% hurdle. The early-default fund earns a fund-level IRR of 7.24%; the late-default fund earns 7.59%. The LP's net IRR is 6.97% in both. The 35 basis point timing benefit of late losses went entirely to the manager: $2.6 million of carry against $1.2 million.
The mechanism is the catch-up tier, and it is worth seeing exactly. The modeled waterfall is whole-fund: distributions return capital first, then pay the LP its 7% preferred return, then pay the GP a full catch-up until the GP holds 10% of cumulative profit, and only then split 90/10. Carry is paid in the final year in both cases, after all capital has come back, so nothing was paid early and no clawback is involved. What differs is how much preferred return accrued along the way. In the early-default case capital comes back more slowly, the 7% accrues on a larger outstanding balance for longer, and the LP's preferred entitlement totals $25.2 million. In the late-default case capital comes back faster while the first loans are still performing, the entitlement totals $23.6 million, and the $1.6 million difference falls into the catch-up tier, where the GP takes all of it.
The general point is that a fund sitting inside its catch-up band pins the LP at the hurdle. Below the hurdle, as in the four-default case, the LP bears every basis point of timing; the manager earns no carry either way. Inside the catch-up band the manager takes every basis point of fund-level improvement, timing included, until the catch-up completes. Above it, the split reverts to 90/10, which is what the PIK case shows: there the two-default fund is past the catch-up, carry is identical across placements, and the LP keeps 41 of the 43 basis points. An LP who has modeled default timing but not where the fund lands relative to its hurdle and catch-up has modeled half the question. The same is true of any marginal improvement a manager claims for the LP's benefit while the fund is inside that band.
How general is this
A single case can be a coincidence of its parameters, so the study re-ran the fund across a parameter sweep: every default count from zero to sixteen, every loss severity from 5% to 95%, four loss placements, four points in the loan's life where a defaulted loan stops paying, three coupons, four PIK levels, three loan terms and three fee-and-carry sets. Just over 530,000 fund simulations. Four things hold across the whole space.
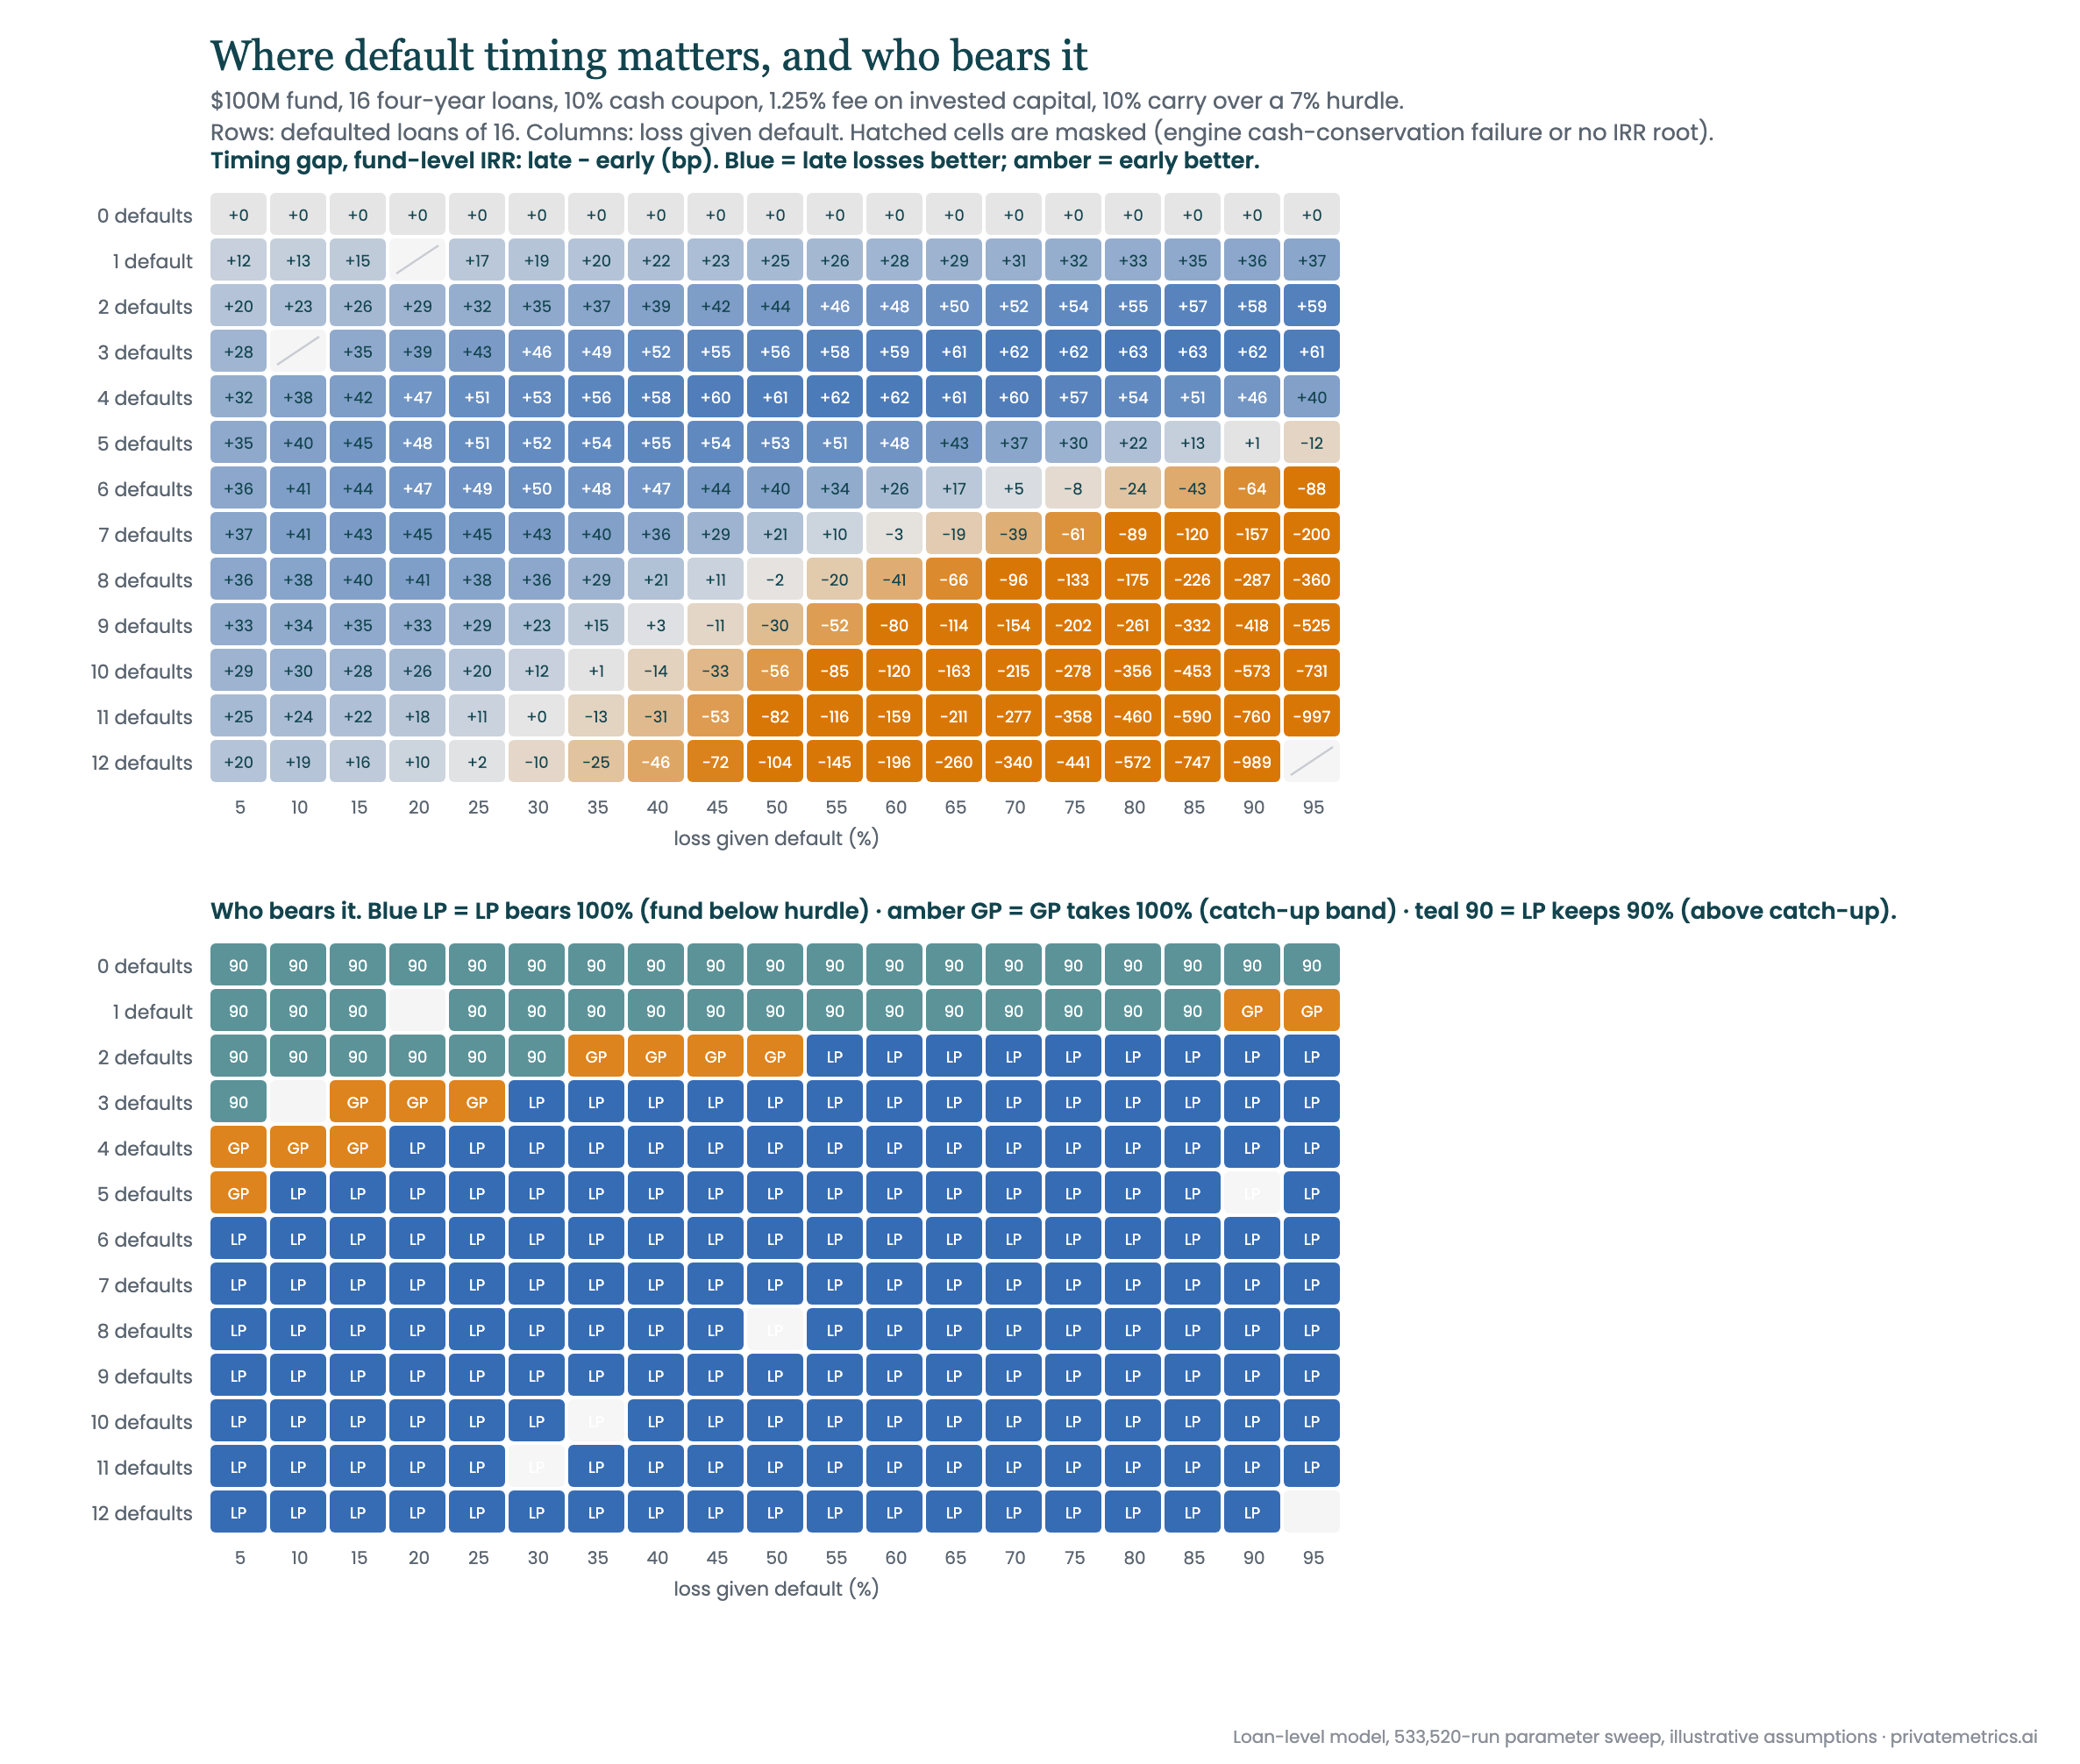
How to read the figure. Both panels put the number of defaulted loans on the vertical axis, from none to twelve, and the loss given default on the horizontal, from 5% to 95%; every cell is a fund identical to the base fund except for those two numbers, run under the early and the late placement. The upper panel colours each cell by the gap in fund-level IRR between late and early losses, in basis points: blue where late losses are better, amber where early losses are better, and the boundary between them is the diagonal along which the fund's own IRR crosses zero. The base case of this article sits at four defaults and 30% severity, in the blue region, at 53 basis points. Moving right along a row (larger losses on the same number of loans) raises the gap until the fund's return approaches zero, then shrinks and reverses it; moving down a column (more defaulted loans at the same severity) does the same. The lower panel takes the same grid and asks who receives the gap: blue where the fund is below its hurdle and the LP bears all of it, amber in the thin band where the fund is in its catch-up and the GP takes all of it, teal where the fund is above the catch-up and the LP keeps 90%. White cells are runs excluded by the study's cash-conservation check. Four things follow.
The effect is bounded. In the base fund the gap between late and early losses peaks at 63 basis points of IRR, at three defaults with 80% severity. Nowhere in a realistic credit book does timing alone move IRR by more than about two-thirds of a point. Coupon and PIK scale it: at a 12% coupon the peak is 97 basis points, at 5% PIK it is 149. Loan term and the point in a loan's life where it stops paying barely move it.
The direction follows the sign of the fund's return. Across every clean early-versus-late pair in the sweep, 95,216 of them, the gap has the sign of the fund's IRR, without exception. Late losses are better than early ones only while the fund is making money. For a fund that will lose money, early recognition is better, because capital left in a losing book compounds the loss. The diagonal in the upper heatmap where blue turns to amber is the fund's break-even line.
IRR is linear in when the losses fall. Moving the defaulted loans one origination slot later in the book, three months in this fund, adds a near-constant 3 to 5 basis points of IRR across the realistic region, to within a basis point. A rule of thumb follows: in a direct-lending fund with a quarter of its loans defaulting, each year later the losses land is worth roughly 15 to 20 basis points of net IRR, with the loss amount unchanged.
Who bears it is decided by the waterfall, not by the losses. The lower heatmap is the catch-up band from the previous section drawn across the whole space. It is thin, it sits where a fund lands just above its hurdle, and inside it the manager takes the entire timing effect. Under a cheaper fee set with a 6% hurdle, the headline cell's 56 basis point fund-level gap reaches the LP as 6.
What to do with it
The punch line. A quoted loss rate fixes the fund's multiple; it does not fix the LP's cash. Holding the loss fixed, when it lands is invisible in every terminal number credit managers are compared on, is worth tens of basis points of IRR in a direction that depends on whether the fund is profitable, and is worth a fifth of investment-period distributions and several points of commitment in peak funding, in an amount set by how many loans stop paying rather than how much is lost on each. Loss timing is a second-order return question and a first-order liquidity question, and the waterfall decides whether the LP receives even the return part. None of this re-ranks managers: four defaults cost the base fund about 250 bp of IRR, their placement about 50 bp. It does mean that a reserve, a read of interim DPI, or a read of a hurdle position built on the loss rate alone is built on the wrong number. Four rules follow.
1. Ask for the loss calendar, not only the loss rate. No terminal statistic of a prior fund can reveal when its losses landed, so ask directly: the distribution of age-at-default across prior funds, in years of fund life, with recovery timing. Early clustering describes origination discipline; late clustering describes what happened after the investment period closed, which interim reporting will not have shown. The same request separates a low loss rate on a young book from a low loss rate on a sound one.
2. Size the reserve on the early-loss case and on default count. The extra funding under early losses is the coupon foregone during the investment period: $3.2 million on a $100 million commitment at four defaults here, and $1.0 to $4.1 million for one to seven, identical at every severity from 5% to 95%. A liquidity stress that raises loss severity leaves the trough unchanged; the stress that moves the reserve is the number of loans that stop paying early. Across a program of overlapping funds with correlated credit cycles, a pacing plan that relies on fund N's distributions to meet fund N+2's calls is assuming a loss-timing profile.
3. Read interim DPI as a timing signal, not a size signal. A clean year-four DPI is consistent with a clean book and with a book whose defaults have not yet matured; the successor-fund decision needs the age and payment status of each loan, not the fund's distribution record. It cuts both ways: an early-loss fund at year four looks a fifth worse on distributions than it will finish, and nothing worse on the multiple, so it should not be marked down at the re-up by more than the timing effect, some 15 to 20 bp per year of shift.
4. Locate the fund in its waterfall before crediting the LP. An improvement in fund-level return, from late losses, a recovery or a restructuring, reaches the LP in full below the hurdle, not at all inside the catch-up band, and net of carry above it. "Our losses came late" is a statement about the GP's carry whenever the fund sits in the band, which is exactly where a fund with one or two defaults lands. A secondary buyer pricing a credit fund's remaining cash flows should apply the same test.
Sources and method
The model constructs the fund from the loan up: each loan's drawdown, coupon, closing fee, PIK accrual, default and recovery are modeled monthly, aggregated into the fund's cash flows, and passed through the fee and waterfall terms to produce the LP's net cash flows. DPI, IRR and multiple are computed from those net flows. Every run is checked for cash conservation: the sum of what the fund receives equals the sum of what the waterfall distributes, to the dollar.
The gross-to-net bridge for the no-default cash-pay case, so the 8.19% can be traced: the loans themselves yield 11.05% at the loan level. Closing fees retained inside the fund rather than distributed take that to 10.38% for the LP. Organization cost and partnership expenses take 25 basis points, the management fee 124 basis points, and carry 70 basis points, to 8.19%. Fees and carry together take just under three points, which is what a 1.25% fee on invested capital does to a 10% coupon over the life of the loans.
Loans are equal-sized bullets; recovery is realized at maturity; a defaulted loan stops paying at the midpoint of its life. Each of those is a simplification. Real books have amortization, restructurings that extend maturity, and recoveries that arrive early or late. None of them changes the mechanism, and all of them can be set explicitly in the model; several would make the timing effect larger rather than smaller, because a restructuring that extends a defaulted loan pushes its recovery further out.
The parameter sweep behind the heatmaps is available as a separate note. The study is a single fund. The program-level version, in which several funds' default profiles overlap across a credit cycle, is the natural next question and is where the pacing consequence above becomes measurable rather than illustrative.
The point of the exercise is not the specific basis points. It is that a loss rate quoted as a single number discards the dimension of the loss that an LP's own cash-flow planning is most exposed to. A model that constructs the book loan by loan gives that dimension back.
Proskauer Rose LLP. 2026. Proskauer's Private Credit Default Index Reveals Rate of 2.51% for Q2 2026. Lincoln International. 2026. The Lincoln Private Market Index, Q2 2026 release (13 August 2026). Phalippou, L. 2008. "The Hazards of Using IRR to Measure Performance: The Case of Private Equity." Journal of Performance Measurement 12 (4): 55–66. Companion note with the derivations and the full parameter sweep: PrivateMetrics, Loss Timing in Private Credit (available on request).