Your Funds Call Together and Distribute Together
A private-markets program is usually described on an allocation page: so much buyout, so much private credit, so much real estate and infrastructure, each with a target, an actual, and a pacing plan. On that page the strategies look diversified. In the program's bank account they are not. The funds call capital on the manager's schedule, not the LP's, and those schedules are driven by the same markets. When conditions are strong, funds across strategies find deals and call at once. When conditions turn, exits stall across strategies and distributions fall together. The correlation that matters to a liquidity plan is not the correlation of returns. It is the correlation of cash flows, and it rises when the program can least afford it.
This piece sets out the evidence for that claim and what it means for how a program sizes its reserve and paces its commitments. It is the third of the structural gaps between what an LP chooses and what an LP gets. The first is that an LP chooses commitments, not exposure. The second is that the timing of deployment is worth more than IRR can measure. The third is that the cash flows of the funds an LP holds move together, and a plan built from independent fund-level averages will be wrong in the quarter that matters.
The evidence
The academic record on this point is clear and has been for a decade. Robinson and Sensoy (2016), studying 837 buyout and venture funds from 1984 to 2010, find that both capital calls and distributions rise and fall with public markets: funds call more when markets are strong and distribute more in the same conditions, and distributions move with the cycle more than calls do. The consequence for an LP is that aggregate net cash flow is itself procyclical. In good markets a program receives more than it pays; in bad markets it pays more than it receives, across its funds at once. They also find that venture cash flows are considerably more cyclical than buyout, so a program's correlation structure depends on its strategy mix, not only on its size.
The last three cycles show the same pattern at the level an allocator can see.
2006 to 2007. Buyout deal value set records that stood for fourteen years. Funds across vintages and strategies called capital aggressively into the same eighteen months. Programs that had assumed calls would arrive at each fund's average pace found several funds drawing at once.
2008 to 2009. Exit markets closed. Distributions across the asset class ran at about 11% of net asset value a year, the rate the asset class has shown in each of its downturns, against about 30% in boom years, and the private-equity secondary market, the only exit an LP controls, cleared at deep discounts. Nadauld, Sensoy, Vorkink and Weisbach (2019), using transaction-level data, document that secondary prices in 2009 averaged about half of net asset value. An LP who needed liquidity in that window paid for it twice: once in foregone distributions and once in the discount to sell.
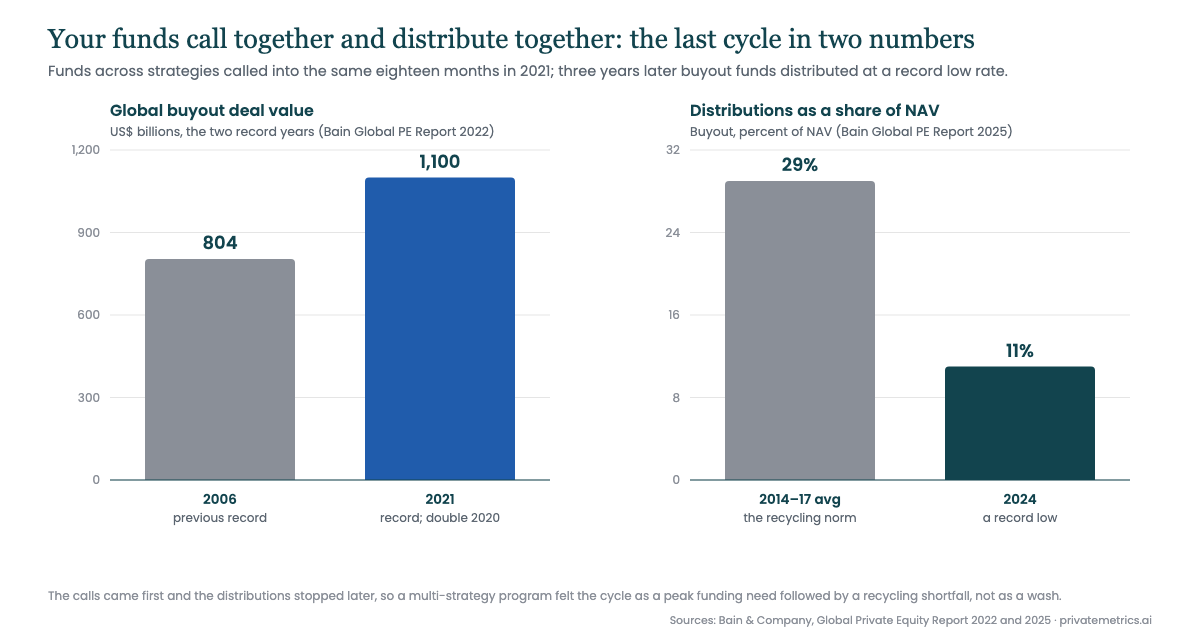
2021 to 2024. The cycle repeated at larger scale. Bain's Global Private Equity Report for 2022 records buyout deal value of $1.1 trillion in 2021, double the prior year and past the 2006 record, with capital called into deals across strategies at once. By 2024 the same report series recorded distributions at 11% of net asset value, a record low and well below the 29% average of 2014 to 2017, and the rate stayed below 15% for a fourth consecutive year in 2025. Programs that had paced their 2021 commitments on the assumption that 2021-level distributions would recycle into 2023 and 2024 calls found that money missing, and many reported drawing on reserves or slowing new commitments.
The pattern in each episode is the same. The surge in calls is correlated across strategies because the deal environment is shared. The drought in distributions is correlated across strategies because the exit environment is shared. And the two do not offset: the calls come first and the distributions stop later, so a program experiences the correlation as a peak funding requirement followed by a recycling shortfall, rather than as a wash.
Why judgment underestimates it
For a single-strategy program of modest size, an experienced allocator can manage this by feel. For a multi-strategy program the problem outgrows intuition for three reasons.
The correlation is time-varying. In normal markets, buyout, credit, real estate and infrastructure cash flows are loosely related, and a fund-by-fund pacing model does reasonably well. In stress, the correlations rise sharply, because the same credit conditions that stall buyout exits also stall real estate refinancings and slow credit repayments. A model calibrated on normal-market correlations understates the peak requirement precisely in the scenario the reserve exists for.
The overlap is combinatorial. Ten funds on independent schedules produce a smooth aggregate; ten funds accelerating together produce a spike, and how many will be in their heaviest calling year at once has no intuitive answer past a handful of vintages and strategies.
The recycling assumption hides the exposure. Most programs fund new commitments partly from distributions on old ones. That assumption is reasonable on average and fails in stress, because distributions are the more cyclical leg. The reserve a program actually needs is set by the correlated quarter in which calls peak and distributions pause, not by the average of either.
What follows for the program
Three consequences, each of which changes a number an allocator already computes.
Size the reserve on the correlated tail, not the average. The figure that matters is the largest plausible net cash demand in a stressed window, across all funds at once, net of distributions that may not arrive. That figure is only visible if the program's cash flows are modeled fund by fund and aggregated, with the stress scenario applied to all funds simultaneously rather than to each in isolation. A program that carries a reserve sized to average unfunded commitments is carrying a number that describes a quarter that will not happen.
Pace against the correlated case, not the independent one. A commitment plan that keeps deployed exposure on target in the average scenario can overshoot badly in a surge, because the calls it assumed would arrive over three years arrive in eighteen months, and undershoot in a drought, because the distributions it assumed would fund the next commitment do not come. The pacing question is not "what schedule hits the target on average" but "what schedule keeps the peak inside the reserve and the trough inside the target band across the plausible range of cycles." That is a range question, and it is the reason the trade-off between deployed exposure and liquidity is a frontier rather than a point.
Treat strategy mix as a cash-flow decision, not only a return decision. Adding a more cyclical strategy to a program adds correlated call and distribution risk that the allocation page does not show. Venture is the clearest case in the academic evidence, but the same logic applies to any strategy whose exits depend on the same credit and equity conditions as the rest of the book. The idle-capital drag that a private-credit program carries is the mirror image: capital committed but waiting is the cost of holding the reserve that correlated calls require.
The number to ask for, then, is the peak net call across all funds in the stressed quarter, and the reserve and pacing that keep it inside the program's limits.
How to see it
None of this requires forecasting the cycle. It requires modeling the program's cash flows at a resolution fine enough to see overlap, monthly rather than annually, fund by fund, and then asking a systematic question of the model: across a spanned range of deployment speeds, distribution rates and correlation levels, where does the peak net call land, and what reserve and pacing keep it inside the program's limits? Spanning the parameter range systematically, rather than sampling it, ensures that the correlated corner of the space is examined rather than hoped for. The output is not a prediction. It is a map of the conditions under which the current plan holds and the conditions under which it does not, which is the form a liquidity policy should take.
The question worth putting to any program: in the last two cycles, how many of your funds were in their heaviest calling year at the same time, and did your reserve know?
Sources
Robinson, D. T., and B. A. Sensoy. 2016. "Cyclicality, Performance Measurement, and Cash Flow Liquidity in Private Equity." Journal of Financial Economics 122 (3): 521–543.
Nadauld, T. D., B. A. Sensoy, K. Vorkink, and M. S. Weisbach. 2019. "The Liquidity Cost of Private Equity Investments: Evidence from Secondary Market Transactions." Journal of Financial Economics 132 (3): 158–181.
Bain & Company. 2022. Global Private Equity Report 2022. Bain & Company. 2025. Global Private Equity Report 2025 (Figure 18: distributions as a share of NAV, 2014–2024). Bain & Company. 2026. Global Private Equity Report 2026.
Capital Dynamics. "Private equity liquidity – Is a distribution wave coming?" Private Equity Insight, June 2013, on Thomson One data as of June 10, 2013. (Distributions averaged 11% of NAV in downturn periods, 1991–92, 2001–02 and 2008–09, against 30% in boom periods.) https://www.capdyn.com/Customer-Content/www/news/PDFs/private-equity-insight-is-a-distribution-wave-coming-june-2013v2.pdf